


Description
IB ESS Practical 2.3A: Systems Diagram of the Carbon Cycle 
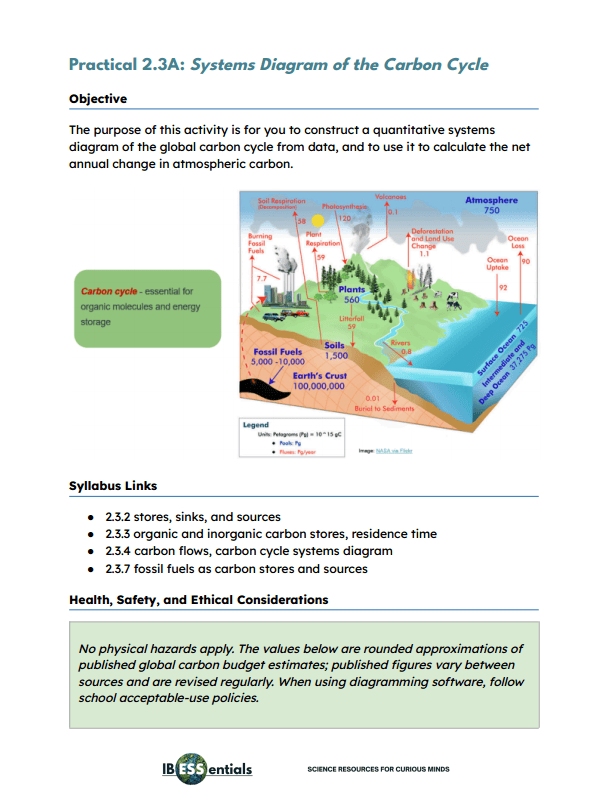
Help students see the global carbon cycle as a quantitative system by having them build a scaled systems diagram from published carbon budget data.
In this practical activity, students work from two data tables of approximate global values. The first gives seven carbon stores in GtC: the atmosphere, vegetation, soils, permafrost, the surface ocean, the intermediate and deep ocean, and fossil fuel reserves. The second gives six annual flows in GtC year⁻¹, including photosynthesis, respiration and decomposition, ocean uptake and release, fossil fuel combustion, and land-use change. Students:
- Sort the data: identify which values are stores and which are flows
- Draw to scale: plan the layout, then draw each store as a box and each flow as an arrow scaled to its size, recording the scale used
- Classify the flows: label every arrow and classify it as a transfer or a transformation
- Calculate the balance: work out the total annual flow into and out of the atmosphere and the net annual change in atmospheric carbon
- Classify the stores: decide whether each acts as a store, sink, or source based on its net flows
- Calculate residence time: divide the atmospheric store by its total annual outflow to find how long carbon stays in the atmosphere
Write-in space is provided for the finished diagram and the residence time calculation.
The data are balanced so that the atmosphere’s net annual gain is close to the observed real-world increase, giving students a meaningful anchor for their result. The activity applies the quantitative diagramming approach from Topic 1 to a biogeochemical cycle.
IB ESS Internal Assessment Skills
This activity is assessed using IB ESS Internal Assessment Criterion D: Treatment of Data, and the full rubric is included. Students must:
- Present a scaled systems diagram with every store and flow labeled, classifying each flow as a transfer or a transformation
- Calculate the net annual change in atmospheric carbon and the atmospheric residence time, showing all working and explaining what each value shows
- Use their diagram to explain how human activities have turned stores into sources, and evaluate how the approximations in the data limit the accuracy of their calculations
The activity gives students practice in communicating complex quantitative data visually and processing it into meaningful results. It also introduces the evaluative thinking they need for Criterion F by asking how approximate data limit a conclusion. The teacher’s notes recommend checking the values against the latest Global Carbon Budget or IPCC assessment, since published estimates are revised regularly.
Ideal for
- Teaching the carbon cycle
- Constructing quantitative systems diagrams
- Teaching carbon stores, sinks, and sources
- Calculating residence time
- Distinguishing transfers and transformations
- Explaining human impacts on the carbon cycle
- Linking ecology to climate change
- Preparing students for the IB ESS Internal Assessment
Digital download. No physical product will be shipped.


You must be logged in to post a comment.