


Description
IB ESS Practical 2.2D: Energy Transfer Efficiency 
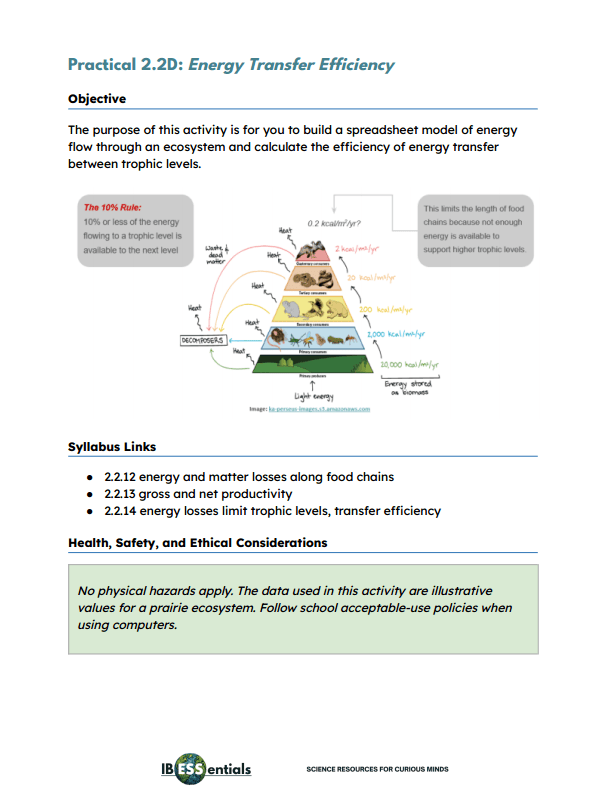
Show students why food chains are short by having them build a spreadsheet model of energy flow and test it.
In this practical activity, students enter annual energy flow data for a prairie ecosystem into a spreadsheet, with one row for each trophic level from producers to quaternary consumers. They then add formulas to:
- Calculate transfer efficiency between each pair of consecutive trophic levels
- Separate energy losses into heat from respiration and waste and dead organic matter passed to decomposers
- Total the losses across all trophic levels
- Calculate producer efficiency in converting solar energy into biomass
Students plot energy stored against trophic level. They then test their model by changing the transfer efficiency to 5% and then 20%, recording how many trophic levels each version could support before stored energy falls below 1 kJ m⁻² year⁻¹.
The data deliberately give transfer efficiencies of roughly 8% to 14%, which helps students understand that the familiar “10% rule” is neither fixed nor a true average.
IB ESS Internal Assessment Skills
This activity is assessed using IB ESS Internal Assessment Criteria D: Treatment of Data and E: Analysis and Conclusion, and the full rubrics are included. Students must:
- Present their spreadsheet model, efficiency calculations, and graph, showing the formula used in each column
- Analyze how transfer efficiency varies between trophic levels, including the uncertainty introduced by assuming losses are split equally between heat and waste
- Draw a conclusion about why the ecosystem cannot support more trophic levels, using the results of their efficiency test as evidence
Students practice building and testing a quantitative model in a spreadsheet, and showing formulas makes their processing fully auditable. These are valuable skills for any data-driven IA. The teacher’s notes also address a common misconception: organisms at higher trophic levels do not need to eat more food to get enough energy.
Ideal for
- Teaching energy transfer efficiency
- Teaching energy losses in food chains
- Explaining why food chains are short
- Challenging the 10% rule
- Building spreadsheet models in science
- Teaching the second law of thermodynamics in ecosystems
- Preparing students for the IB ESS Internal Assessment
Digital download. No physical product will be shipped.
Short description:
Students build a spreadsheet model of energy flow through a prairie ecosystem, calculate transfer efficiency between trophic levels, and test how efficiency limits food chain length.


You must be logged in to post a comment.