


Description
IB ESS Practical 2.2A: Systems Diagram of an Ecosystem 
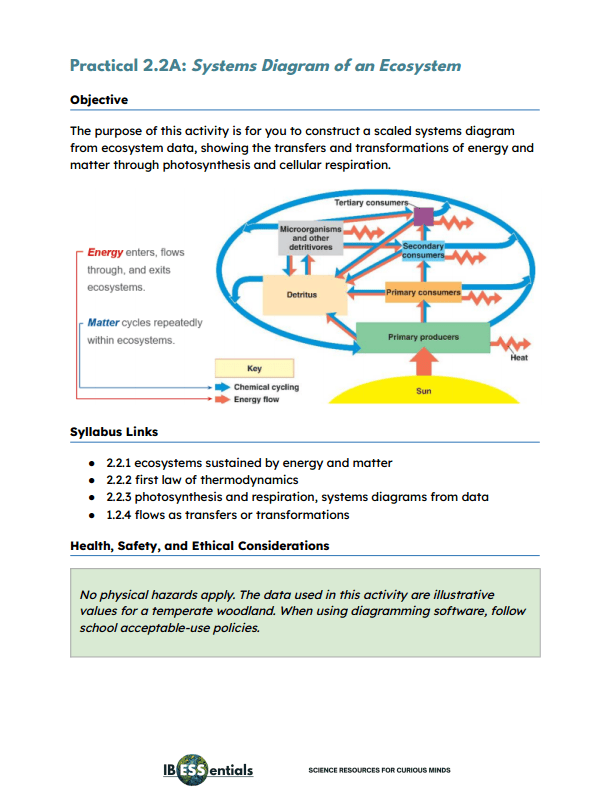
Show students where an ecosystem’s energy actually goes by having them build a scaled systems diagram from real-world-style energy data.
In this practical activity, students work from a data set of annual energy flows in a temperate woodland, from solar radiation reaching the canopy through to energy stored as primary consumer biomass. They:
- Classify the data: identify every storage and every flow, then classify each flow as a transfer or a transformation with a one-sentence justification
- Draw to scale: represent storages as boxes and flows as arrows, scaling each to the quantity it represents and recording the scale used
- Define the system: draw a labeled system boundary showing the inputs and outputs that cross it
- Check the energy budget: verify at every storage that energy in equals energy out plus energy stored, and annotate where the first law of thermodynamics can be seen in the figures
Drawing to scale is what makes the key patterns obvious. Around 99% of incoming solar radiation is never fixed by producers, and far more producer energy passes to decomposers than to herbivores. Both surprise students, and both are only visible when the diagram is proportional. The activity also includes a write-in data table and space for the finished diagram.
IB ESS Internal Assessment Skills
This activity is assessed using IB ESS Internal Assessment Criteria C: Method and D: Treatment of Data, and the full rubrics are included. Students must:
- Describe how they built their diagram, including the scaling rule, clearly enough for another student to produce an equivalent one
- Present the completed diagram with the calculations used to scale each component and verify the energy balance at each storage
- Identify which flows are transformations and explain one way the diagram simplifies the real ecosystem
The activity gives students practice in communicating quantitative data visually and checking their own processing for errors. The data are internally balanced, so every storage should reconcile exactly. It also builds directly on the systems diagrams introduced in Topic 1.
Ideal for
- Teaching energy flow through ecosystems
- Constructing quantitative systems diagrams
- Distinguishing transfers and transformations
- Teaching the first law of thermodynamics
- Teaching photosynthesis and respiration as energy processes
- Connecting Topic 1 systems thinking to ecology
- Preparing students for the IB ESS Internal Assessment
Digital download. No physical product will be shipped.


You must be logged in to post a comment.