


Description
IB ESS Practical 2.1E: Measuring Abundance with Quadrats
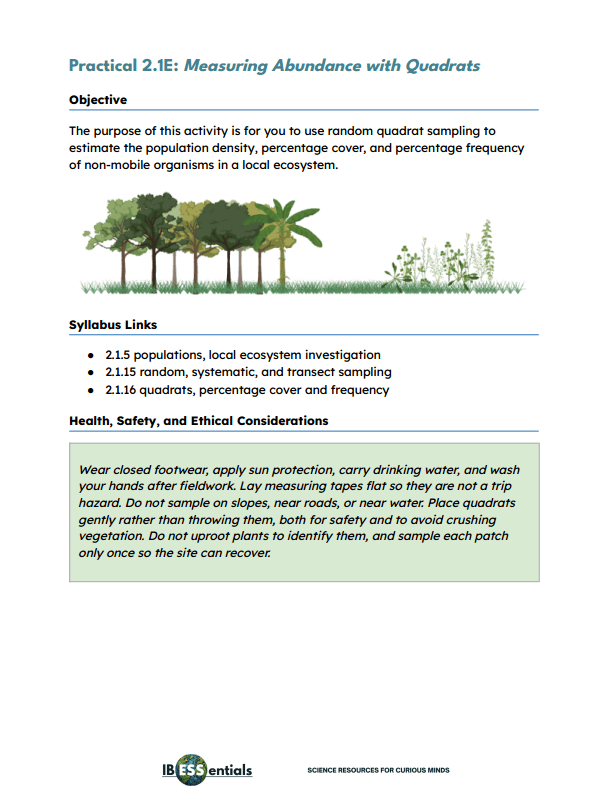
Give students authentic ecological fieldwork experience with random quadrat sampling, measures of abundance, and an introduction to Simpson’s diversity index.
In this practical activity, students define a study area and lay two measuring tapes at right angles to create a coordinate grid. They use randomly generated coordinates to place at least 15 quadrats. At each one, they record every species present, count individuals where possible, and estimate percentage cover in 5% intervals.
From the same data set, students then calculate three measures of abundance for one named species:
- Population density: total individuals counted ÷ total area sampled
- Mean percentage cover: average cover across all quadrats
- Percentage frequency: quadrats containing the species ÷ total quadrats × 100
Students finish by comparing the three measures and recording which species are best described by counts and which are better described by cover.
The activity also introduces the key vocabulary of biodiversity measurement: species richness, evenness, abundance, and biodiversity. It includes a guide to Simpson’s diversity index that explains both versions of the index accepted in the ESS course, along with a video resource. This lets students see how the same quadrat data can be used to quantify the diversity of a community.
IB ESS Internal Assessment Skills
This activity is assessed using IB ESS Internal Assessment Criteria C: Method and D: Treatment of Data, and the full rubrics are included. Students must:
- Describe their random sampling method clearly enough for another student to repeat it, including how coordinates were generated and how cover was estimated
- Present their raw quadrat data and show the processing steps for all three calculations
- Justify which measure best describes their chosen species, identify a source of uncertainty in estimating percentage cover, and suggest how to reduce it
This is valuable preparation for fieldwork-based IAs because students discover that density, percentage cover, and percentage frequency are not interchangeable. Counting individual grass plants is impractical, and the cover of a scattered species can be misleading. Many IA investigations compare the diversity of different sites, so an early introduction to Simpson’s index gives students a tool they are likely to use again. The teacher’s notes emphasize choosing the measure that suits the organism, and placing quadrats rather than throwing them to avoid bias.
Ideal for
- Teaching quadrat sampling
- Introducing random sampling with coordinates
- Calculating population density
- Calculating percentage cover and percentage frequency
- Comparing measures of abundance
- Introducing species richness and evenness
- Introducing Simpson’s diversity index
- Developing ecological fieldwork skills
- Preparing students for the IB ESS Internal Assessment
Digital download. No physical product will be shipped.


You must be logged in to post a comment.