


Description
IB ESS Practical 2.1D: Modeling Population Interactions 
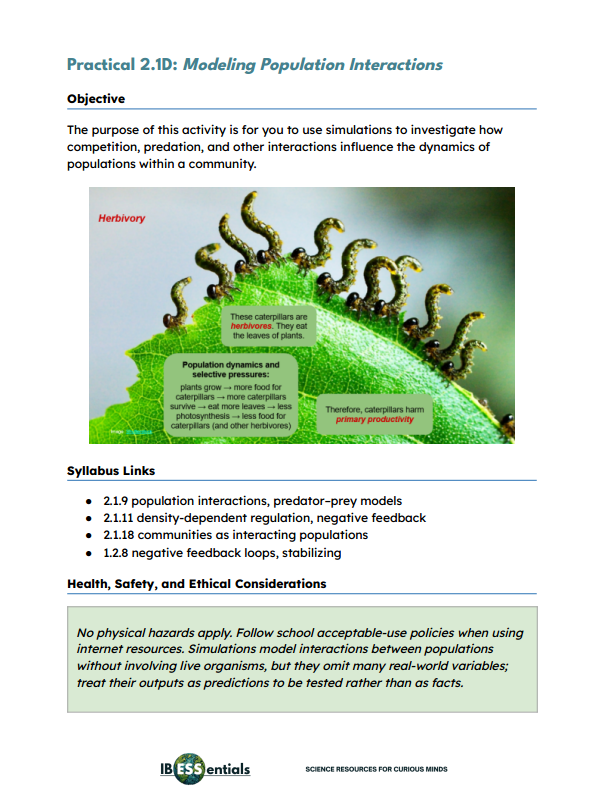
Help students see how competition, predation, and other interactions shape the dynamics of a community with this three-part simulation activity.
In this practical activity, students use an ecology simulator and a Lotka–Volterra predator–prey simulation to build up an understanding of population interactions step by step:
- Part 1 — Competition: students predict whether two producer species can coexist, run the simulation, and explain why one outcompetes the other
- Part 2 — Adding consumers: students introduce a herbivore and then an omnivore, record the effects on every population, and adjust diets until all populations coexist
- Part 3 — Predator–prey oscillation: students change prey birth rate, prey death rate, predator birth rate, and predator death rate one at a time, measuring the amplitude and period of the resulting oscillations
Students then plot oscillation amplitude against each parameter value to identify which factor has the greatest effect on the stability of the two populations.
The sequence moves from competitive exclusion to community-wide effects to quantified predator–prey coupling. This links population dynamics back to the negative feedback and systems thinking introduced in Topic 1.
IB ESS Internal Assessment Skills
This activity is assessed using IB ESS Internal Assessment Criteria D: Treatment of Data and E: Analysis and Conclusion, and the full rubrics are included. Students must:
- Present population data from all three parts and explain how they measured oscillation amplitude and period
- Analyze patterns in the predator–prey oscillations, identify the most influential parameter, and state the uncertainty of reading values from simulation graphs
- Explain how predator–prey coupling acts as a negative feedback mechanism and draw a conclusion about the conditions that allowed competing species to coexist
The activity gives students practice in changing one variable at a time, defining how a measurement was made, and naming specific uncertainties rather than generic ones. The teacher’s notes stress making predictions before running the simulation, which keeps the reasoning genuine.
Ideal for
- Teaching population interactions
- Teaching competition and competitive exclusion
- Teaching predator–prey relationships
- Introducing Lotka–Volterra models
- Teaching negative feedback in ecosystems
- Using simulations to investigate communities
- Preparing students for the IB ESS Internal Assessment
Digital download. No physical product will be shipped.


You must be logged in to post a comment.